|
|
 |
MapMan
|
|
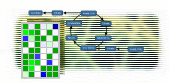
MapMan is a user-driven tool that displays large datasets (e.g. gene expression data
from Arabidopsis Affymetrix arrays) onto diagrams of metabolic pathways or other processes.
MapMan was developed in cooperation with the group
of Mark Stitt.
For technical details, please contact Axel Nagel, for other questions, please contact Björn Usadel.
|
| |
 |
| Download MapMan Software: Version 3.0.0 from
17.06.2009 (history) |
- features visualization for multiple assays simultaneously.
- New exportable table based displays of mapped data for pathway visualization
- Many usability enhancements and the usual bug fixes
- Fixed MS Windows Vista Problems
|
| View Applicable License agreement |
|
The Ultimate MapMan Install and Usage Guide MapManGuid.pdf * new . |
|
Download MapMan pathway, mapping and sample data files. |
|
MapMan Forum:
Post your questions, feature request and bug reports. |
|
MapMan web-application: View some sample data sets. |
|
MapMan annotation experts |
| |
| |
Reference: Usadel B, Nagel A, Thimm O,
Redestig H, Blaesing OE, Palacios-Rojas N, Selbig J, Hannemann J, Piques MC, Steinhauser D, Scheible WR, Gibon Y, Morcuende R, Weicht D, Meyer S and M Stitt (2005),
Extension of the visualization tool MapMan to allow statistical analysis of arrays, display of corresponding genes, and comparison with known responses.
Plant Physiol. 138(3):1195-204. |
| |
Reference: Thimm O, Blaesing O, Gibon Y,
Nagel A, Meyer S, Krüger P, Selbig J, Müller LA, Rhee SY and M Stitt (2004) MAPMAN: a user-driven tool to display genomics data sets onto diagrams of
metabolic pathways and other biological processes. Plant J. 37(6):914-39.
Selected as fast breaking paper in plant and animal sciences:
http://www.esi-topics.com/fbp/2005/february05-OliverThimm.html
257 times cited (August 2009). |
| |
Acknowledgement: We would like to thank the TAIR team for their kind
support in data annotation and good advices. |
|
|
|